These questions are guranteed to be asked in Machine Learning Engineer or ML based interviews for upto 80% of your job interviews.
Make sure that you cover and know about machine learning. These questions can Ace your interviews regarding ML even
if you are a fresh graduate or upto 5 years of experience.
The Image references are only for Educational Purposes. These are totally made by the creators, specified in the reference.md file.
Sharing is Caring:
Feel Free to Share the Questions/References Link into your blog.
Questions
Difference between SuperVised and Unsupervised Learning?
    Supervised learning is when you know the outcome and you are provided with the fully labeled outcome data while in unsupervised you are not
    provided with labeled outcome data. Fully labeled means that each example in the training dataset is tagged with the answer the algorithm should
    come up with on its own. So, a labeled dataset of flower images would tell the model which photos were of roses, daisies and daffodils. When shown
    a new image, the model compares it to the training examples to predict the correct label.
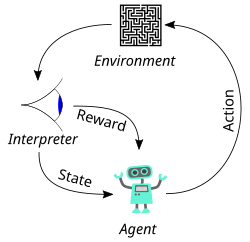
What is Reinforcment Learning and how would you define it?
    A learning differs from supervised learning in not needing labelled input/output pairs be presented, and in not needing sub-optimal actions to be
    explicitly corrected. Instead the focus is on finding a balance between exploration (of uncharted territory) and exploitation (of current
    knowledge) .Semisupervised learning is also known as Reinforcment learning, in reinforcment learning each learning steps involved a penalty
    criteria whether to give model positive points or negative points and based on that penalizing the model.
What is Deep Learning ?
    Deep learning is defined as algorithms inspired by the structure and function of the brain called artificial neural networks(ANN).Deep learning
    most probably focuses on Non Linear Analysis and is recommend for Non Linear problems regarding Artificial Intelligence.
Difference between Machine Learning and Deep Learning?
    Since DL is a subset of ML and both being subset of AI.While basic machine learning models do become progressively better at whatever their
    function is, they still need some guidance. If an AI algorithm returns an inaccurate prediction, then an engineer has to step in and make
    adjustments. With a deep learning model, an algorithm can determine on its own if a prediction is accurate or not through its own neural network.
Difference between SemiSupervised and Reinforcment Learning?
Difference between Bias and Variance?
    Bias is definned as over simpliciation assumption assumed by the model,
    Variance is definned as ability of a model to learn from Noise as well, making it highly variant.
    There is always a tradeoff between these both, hence its recommended to find a balance between these two and always use cross validation to
    determine the best fit.
What is Linear Regressions ? How does it work?
    Fitting a Line in the respectable dataset when drawn to a plane, in a way that it actually defines the correlation between your dependent
    variables and your independent variable. Using a simple Line/Slope Formulae. Famously, representing f(X) = M(x) + b.
    Where b represents bias
    X represent the input variable (independent ones)
    f(X) represents Y which is dependent(outcome).

    The working of linear regression is Given a data set of n statistical units, a linear regression model assumes that the relationship between the
    dependent variable y and the p-vector of regressors x is linear. This relationship is modeled through a disturbance term or error variable ε — an
    unobserved random variable that adds "noise" to the linear relationship between the dependent variable and regressors. Thus the model takes the
    form Y = B0 + B1X1 + B2X2 + ..... + BNXN
    This also emplies : Y(i) = X(i) ^ T + B(i)
    Where T : denotes Transpose
    X(i) : denotes input at the I'th record in form of vector
    B(i) : denotes vector B which is bias vector.
UseCases of Regressions:
    Poisson regression for count data.
    Logistic regression and probit regression for binary data.
    Multinomial logistic regression and multinomial probit regression for categorical data.
    Ordered logit and ordered probit regression for ordinal data.
What is Logistic Regression? How does it work?
    Logistic regression is a statistical technique used to predict probability of binary response based on one or more independent variables.
    It means that, given a certain factors, logistic regression is used to predict an outcome which has two values such as 0 or 1, pass or fail,
    yes or no etc
    Logistic Regression is used when the dependent variable (target) is categorical.
    For example,
        To predict whether an email is spam (1) or (0)
        Whether the tumor is malignant (1) or not (0)
        Whether the transaction is fraud or not (1 or 0)
    The prediction is based on probabilties of specified classes
    Works the same way as linear regression but uses logit function to scale down the values between 0 and 1 and get the probabilities.
What is Logit Function? or Sigmoid function/ where in ML and DL you can use it?
    The sigmoid might be useful if you want to transform a real valued variable into something that represents a probability. While the Logit function
    is to map probaliticvalues from -Inf to +inf to either real numbers representing True or False towards 1 or 0 (real number). This is commonly used
    in Classification having base in  Logistic Regression along with Sigmoid based functions in Deep learning used to find a nominal outcome in a
    layer or output of a layer.
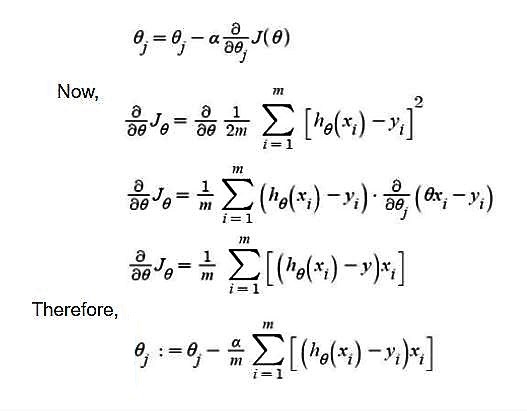
What is Gradient Decent Formula to Linear Regression Equation?
What is Support Vector Machine ? how is it different from OVR classifiers?
    Support Vector Machine is defineed as a Technique which is classification and regression model. Which uses hyper plan estimation and best hyper plane
    fitting the estimate on linear lines drawn same a linear one. Although it can also work for non Linear using kernal tricks on SVM.
    SVM is totally based on Marginal lines (with difference between two classes in the best way possible).
    One Vs rest is the base classifier concept which is used in all the Ml algorithms which involves classification based on Class A vs Classes REst approach. Since here are only two heuristic approaches which are enhancment of Multiclass classificaton to make the binary classifier perform
    well on multi class problems and solve the problem in hand.
    The algorithms which uses OVO are:
        1) Extreme learning Machines(ELM's)
        2) Support Vector Machine(Classifiers)
        3) K Nearest Neighbours.(for neighbouring classes based on distances)
        4) Naive Bayes (based on MAP : Maximum Posterior )
        5) Decision Trees(decision in subnodes after parent node has one feature)
        6) Neural Networks (different nets)
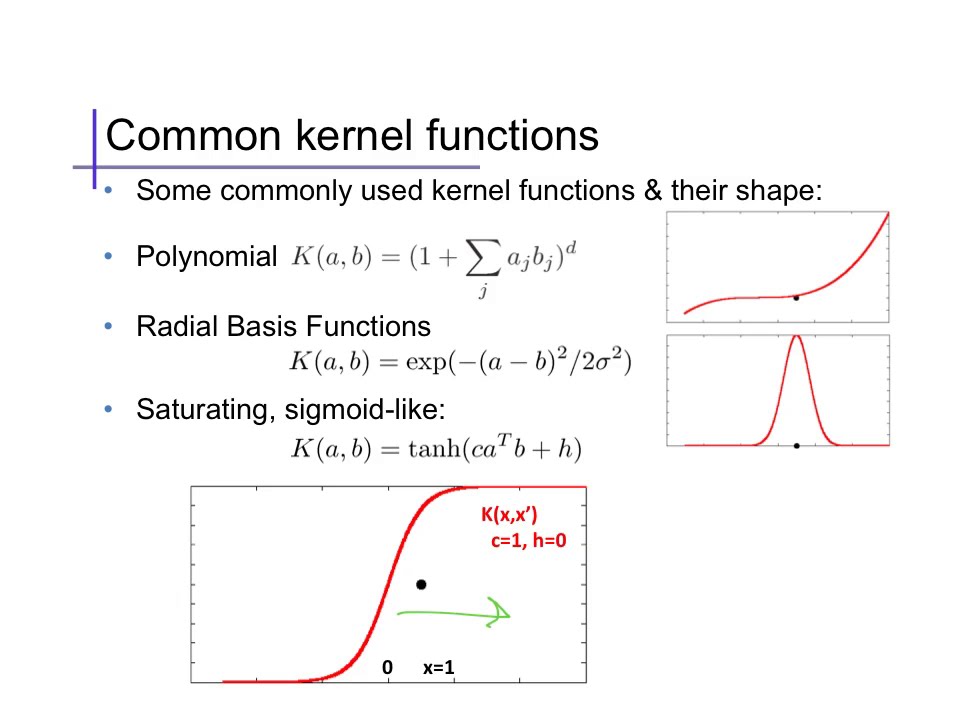
Types of SVM kernels
    Think of kernels as definned filters each for their own specific usecases.

    1) Polynomial Kernels (used for image processing)
    2) Gaussian Kernel (When there is no prior knowledge for data)
    3) Gaussian Radial Basis Function(same as 2)
    4) Laplace RBF Kernel ( recommend for higher training set more than million)
    5) Hyperbolic Tangent Kernel (neural network based kernel)
    6) Sigmoid Kernel(proxy for Neural network)
    7) Anova Radial Basis Kernel (for Regression Problems)
What is different type of Evauation metrics in Regression?
    There are multiple evaluation metrics for Regression Analysis
    1) Mean Squared Error ( the average squared difference between the estimated values and the actual value)
    2) Mean Absolute Error (Absolute of the Average difference)
How would you define Mean absolute error vs Mean squared error?
    MAE : Use MAE when you are doing regression and don’t want outliers to play a big role. It can also be useful if you know that your distribution is multimodal, and it’s desirable to have predictions at one of the modes, rather than at the mean of them.
    MSE : use MSE the other way around, when you want to punish the outliers.
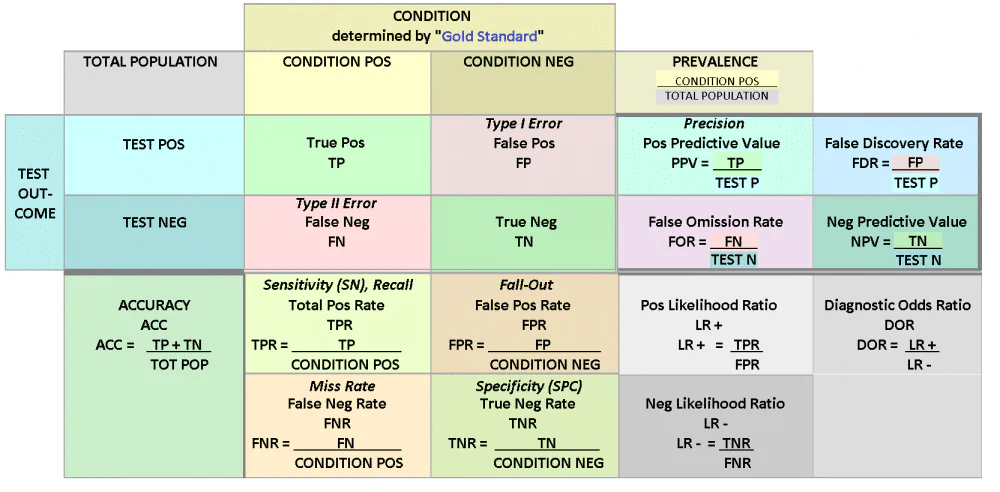
How would you evaluate your classifier?
A classifier can be evaluated through multiple case, having the base case around its confusion metrics and its attributes which are TP, TN , FP and FN. Along with the Accuracy metrics which can be derived alongside Precision, Recall scores.
What is Classification?
    Classification is defined as categorizing classes or entities based on the specified categories either that category exists or not in the respectable data. The concept is quite common for Image based classification or Data Based Classification. The answer in form of Yes or No;
    alongside answers in form of types of objects/classes.
How would you differentiate between Multilabel and MultiClass classification?
    A multiclass defines as a classification outcome which can be of multiple classes either A or B or C but not   two or more than one.
    While in MultiLabel classification, An outcome can be of either one or more than two classes i.e A or A and B or A and B and C.
What is Confusion Matrics?
    A confusion matrix, also known as an error matrix, is a specific table layout that allows visualization of
     the performance of an algorithm, typically a supervised learning one (in unsupervised learning it is
      usually called a matching matrix). Each row of the matrix represents the instances in a predicted class
       while each column represents the instances in an actual class (or vice versa).
    The name stems from the fact that it makes it easy to see if the system is confusing two classes
    (i.e. commonly mislabeling one as another).
Which Algorithms are High Biased Algorithms?
    Bias is the simplifying assumptions made by the model to make the target function easier to approximate.
    1) High bias algorithms are most probably Linear Algorithm, which are concerned with linear relationships or linear distancing. Examples are
    2) Linear, Logistic or Linear Discrimenant Analysis.
Which Algorithms are High and low Variance Algorithms?
    Variance is the amount that the estimate of the target function will change given different training data

    1) High Variance Algorithms are Decision Trees, K Nearest Neigbours and SVMs
    2) Low Variance Algorithms are Linear Regression, Logistic Regression and LDA's
Why are the above algorithms are High biased or high variance?
    Linear machine learning algorithms often have a high bias but a low variance.
    Nonlinear machine learning algorithms often have a low bias but a high variance.
What are root case of Prediction Bias?
    Possible root causes of prediction bias are:

    1) Incomplete feature set
    2) Noisy data set
    3) Buggy pipeline
    4) Biased training sample
    5) Overly strong regularization
What is Gradient Decent? Difference between SGD and GD?
    Gradient Descent is an iterative method to solve the optimization problem. There is no concept of "epoch" or "batch" in classical gradient decent. The key of gradient decent are
    * Update the weights by the gradient direction.
    * The gradient is calculated precisely from all the data points.
    Stochastic Gradient Descent can be explained as:
    * Quick and dirty way to "approximate gradient" from one single data point.
    * If we relax on this "one single data point" to "a subset of data", then the concepts of batch and epoch come.
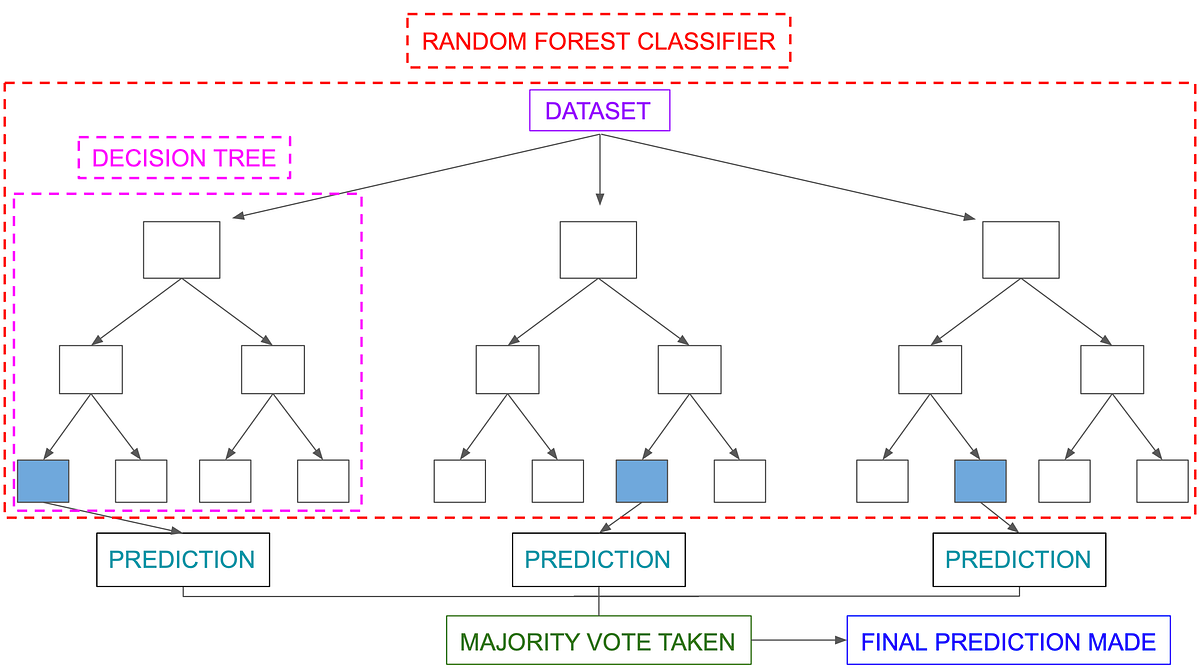
What is Randomforest and Decision Trees?
    A decision tree is a decision support tool that uses a tree-like model of decisions and their possible consequences, including chance event
    outcomes, resource costs, and utility. It is one way to display an algorithm that only contains conditional control statements.

    Random forests or random decision forests are an ensemble learning method for classification, regression and other tasks that operate by
    constructing a multitude of decision trees at training time and outputting the class that is the mode of the classes (classification) or mean
    prediction (regression) of the individual trees. Used to remove the Overfitting occured due to single Decision Trees.
What is Process of Splitting?
Splitting up your data in to subsets based on provided data facts. (can come in handy for decision Trees)
What is the process prunning?
    The Shortening of branches of Decision Trees is termed as Prunning. The process is done in case to reach the decision quite earlier than
    expected. Reducing the size of the tree by turning some branch nodes into leaf nodes, and removing the leaf nodes under the original branch.
How do you do Tree Selection?
    Tree selection is mainly done from the following
    1) Entropy
            A decision tree is built top-down from a root node and involves partitioning the data into subsets that contain instances with similar
            values (homogeneous). ID 3 algorithm uses entropy to calculate the homogeneity of a sample. If the sample is completely homogeneous the
            entropy is zero and if the sample is an equally divided it has entropy of one.
            Entropy(x) -> -p log(p) - qlog(q)  with log of base 2
    2) Information Gain
            The information gain is based on the decrease in entropy after a dataset is split on an attribute. Constructing a decision tree is all about finding attribute that returns the highest information gain (i.e., the most homogeneous branches).

            2.1) Calculate entropy of the target.
            2.2) The dataset is then split on the different attributes. The entropy for each branch is calculated. Then it is added proportionally, to get total entropy for the split. The resulting entropy is subtracted from the entropy before the split. The result is the Information Gain, or decrease in entropy.
            2.3) Choose attribute with the largest information gain as the decision node, divide the dataset by its branches and repeat the same process on every branch.
Pseudocode for Entropy in Decision Trees:
    '''
    from math import log

    def calculateEntropy(dataSet):
    number = len(dataSet)
    labelCounts = {}
    for featureVector in dataSet:
        currentLabel = featureVector[-1]
        if currentLabel not in labelCounts.keys():
        labelCounts[currentLabel] = 0
        labelCounts[currentLabel] +=1
    entropy = 0
    for i in labelCounts:
        probability = float(labelCounts[keys])/number
        entropy -=probability*log(probability,2)
    return entropy
    '''


请发表评论